The price you see
168.1p
per litre, petrol — 2026
Why is fuel so expensive?
The price at the pump is the result of several different costs, taxes and market factors. Not a simplistic answer — the full chain, examined honestly.
Where does the money from one litre go?
Follow one litre
Eight stops between the oil field and your fuel tank — clearly split between market costs and tax.
- 1
Crude oil
Company costsThe underlying commodity cost. Crude oil is traded internationally, and its price can change significantly based on global supply and demand.
- 2
Exchange rates
Company costsOil is generally traded internationally in US dollars. Changes in the pound-to-dollar exchange rate can affect the UK's cost of imported crude and refined products, independent of the dollar price itself.
- 3
Refining
Company costsCrude oil has to be processed into usable fuels. Refining costs and margins can change depending on global supply and demand, refinery capacity, maintenance, and other market conditions.
- 4
Wholesale fuel
Company costsFuel is bought and sold through wholesale markets before reaching individual forecourts. Wholesale prices can move independently of the retail price and may change at different speeds.
- 5
Distribution
Company costsTransportation, storage, terminals, logistics, and distribution infrastructure all add cost between the refinery and the forecourt.
- 6
Retailer / forecourt
Company costsFilling stations have operating costs including staff, electricity, rent or property costs, maintenance, card-payment costs, business rates, insurance, and equipment. Where reliable data exists, we show estimated retailer margins — the difference between wholesale and pump price is not automatically pure profit.
- 7
Fuel Duty
TaxA fixed government tax per litre, set by policy — distinct from any company cost in the chain above.
- 8
VAT
TaxCharged on the fuel transaction, including the duty already added. The amount of VAT paid changes as the underlying taxable price changes.
Petrol (unleaded)
Live data- Wholesale fuel, refining & distribution75.8p (45.1%)
- Fuel duty53.0p (31.5%)
- VAT (20%)28.0p (16.7%)
- Retailer / forecourt margin11.3p (6.7%)
As of 14 September 2026. Source: GOV.UK (fuel duty, VAT) and CMA Enhanced Road Fuel Monitoring report (retailer margin), via GOV.UK
Methodology: Fuel duty (52.95 pence/litre) and the 20% VAT rate are exact, verified figures from GOV.UK, calculated against an average pump price of 168.1p/litre (GOV.UK/DESNZ weekly road fuel prices, week commencing 14 September 2026). The retailer margin (11.3 pence/litre) is the CMA's reported average market-wide petrol margin for April 2026 (Enhanced Road Fuel Monitoring report, published via GOV.UK). 'Wholesale, refining & distribution' is the remainder after duty, VAT, and margin are subtracted — it is a calculated figure, not a separately published one, and bundles crude oil cost, refining, and distribution together since no further verified split was available. Because the margin figure and the pump price are from slightly different dates, this breakdown is an approximation, not an exact same-day figure.
We don't have a further verified split of "wholesale fuel, refining & distribution" into steps 1–5 individually — that level of detail isn't separately published, so we show it as one bundled, verified figure rather than guessing a finer split.
So why can it still cost so much?
The big question
Global oil prices
The UK does not control the global price of crude oil. Global prices can be influenced by many factors at once — no single event explains every price movement.
- Worldwide supply and demand
- OPEC+ production decisions
- Geopolitical events
- Wars and conflicts
- Sanctions
- Refinery disruptions
- Inventories
- Changes in global economic activity
- Expectations about future supply and demand
Sources on global oil markets: the International Energy Agency (IEA), the U.S. Energy Information Administration (EIA), and UK government sources.
Why does the exchange rate matter?
The pound vs the dollar
Say a barrel of crude oil costs a round $75 (a simplified illustrative figure, not a live quote). The table below shows how the sterling cost changes purely because of the exchange rate — even though the dollar price hasn't moved at all.
Weaker pound
£1 = $1.2000
£62.50
for the same $75 barrel
Current verified rate
£1 = $1.3353
£56.17
for the same $75 barrel
Stronger pound
£1 = $1.5000
£50.00
for the same $75 barrel
Current verified rate: £1 = $1.3353 (Bank of England, spot rate, 17 September 2026). Because crude oil and many petroleum products are traded internationally in US dollars, a weaker pound makes the same dollar-priced oil more expensive in sterling terms, and a stronger pound makes it cheaper — independent of any change in the oil price itself.
Crude oil is not petrol
Refining costs
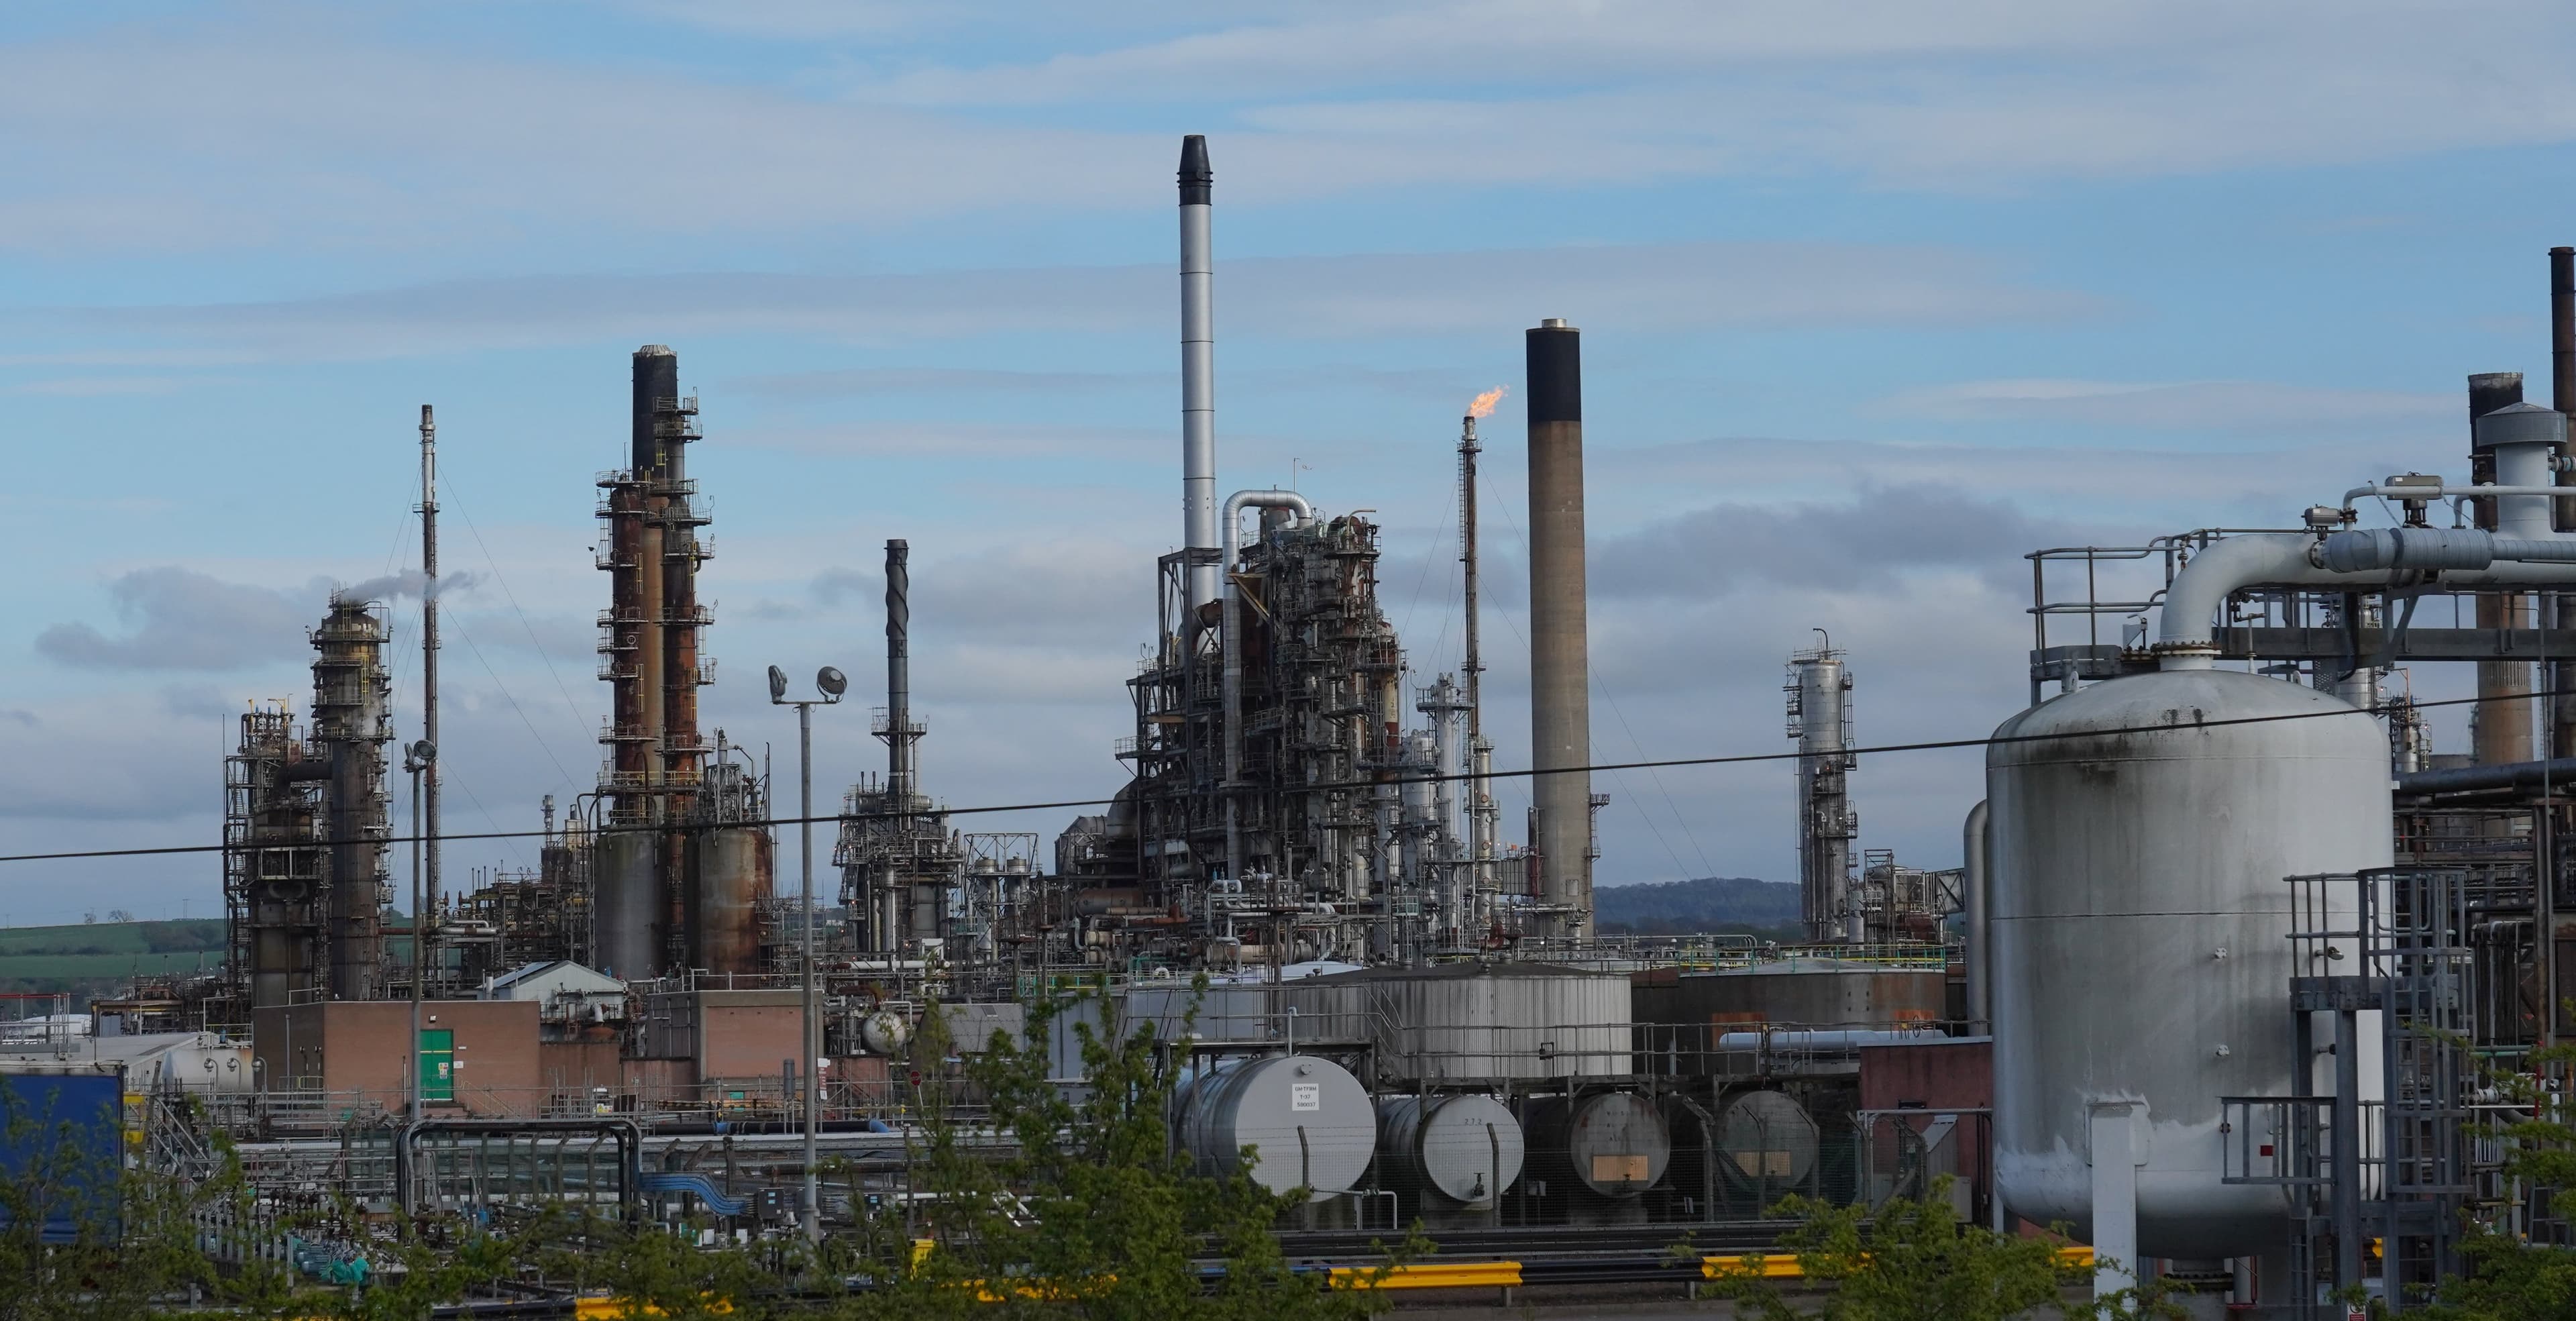
CRUDE ≠ PETROL
Refining turns crude oil into usable fuel
See the chain
Photo: kitmasterbloke, via Wikimedia Commons (CC BY 2.0)
The price of crude oil and the price of refined petrol or diesel are related but are not identical. Refining turns crude oil into usable fuels, and refining margins — the cost and profit associated with that conversion — can change independently of the crude oil price, depending on global refinery capacity, maintenance schedules, and demand for specific fuel types. This is one reason why a fall in crude oil prices does not necessarily mean pump prices fall immediately, or by the same amount.
An investigative question
Do prices rise faster than they fall?
The 'rocket and feather' question — evidence-led, not assumed.
“Rocket and feather” pricing — what regulators actually found
“Rocket and feather” describes a pattern where retail prices rise quickly when wholesale costs increase (like a rocket) but fall only slowly when wholesale costs decrease (like a feather). Do not assume this applies everywhere, all the time — here is what has actually been measured, and when.
RAC analysis, diesel & petrol — Oct–Dec 2022
Petrol wholesale costs fell 23p/litre over 9 weeks (mid-Oct to mid-Dec 2022) but pump prices fell only 18p/litre. Diesel wholesale costs fell 32p/litre over 8 weeks, while pump prices fell only 20p/litre. Average retailer margin on petrol rose from 8.7p (2021) to 13.5p (2022); diesel margin rose from 8.8p to 10.3p.
Source: RAC, 28 January 2023
CMA road fuel market study — final report, 2023
The CMA found evidence of a rocket-and-feather pattern specifically for diesel during 2022, with no equivalent evidence for diesel before that year. Treat this as diesel-specific evidence from a defined period, not a permanent or universal feature of the market.
Source: CMA road fuel market study, final report, 3 July 2023 (secondary reporting cross-checked across independent outlets).
CMA Enhanced Road Fuel Monitoring — August 2026 (data to end June 2026)
The CMA's most recent monitoring report documents a similar asymmetric pattern in 2026: over May–June 2026, petrol margins “generally remain[ed] below their pre-conflict level”, while diesel margins “tended to remain above their pre-conflict level...falling to pre-conflict levels only at the end of June.” The CMA said this “suggests that retailer responses to reductions in wholesale diesel costs may have been more delayed” — attributed partly to “passive pricing strategies”, not to a deliberate change in strategy to exploit the situation.
Source: CMA Enhanced Road Fuel Monitoring report, 18 August 2026
Possible contributing reasons
- Retailers bought their current stock at an earlier wholesale price, before any fall.
- Inventory already purchased has to be sold through before cheaper stock arrives.
- Wholesale prices themselves can move at a different pace than crude oil.
- Refining margins can change independently of the crude oil price.
- Distribution costs (transport, storage, terminals) don't move with crude oil at all.
- Retailer operating costs (staff, rent, energy, card fees) are largely fixed in the short term.
- The level of local competition can affect how quickly a retailer chooses to cut prices.
- Fuel Duty is a fixed amount per litre, so it doesn't fall at all when wholesale costs fall.
- Currency movements can offset or amplify a change in the dollar oil price.
What the evidence does — and doesn't — show.
What are forecourts making?
Competition and retail margins
The difference between the wholesale price and the retail price is not automatically the retailer's profit — it covers running costs including staff, business rates, card processing fees, and site maintenance, as well as any profit margin.
| Period | All retailers | Supermarkets | Non-supermarkets |
|---|---|---|---|
| 2025 average | 10.7p | 9.8p | 11.3p |
| May 2026 | 11p | 10.7p | 11.3p |
| June 2026 | 11.2p | 10.4p | 12p |
Margins are averaged across 11 retailers covering roughly 40% of UK stations and 60% of fuel sales volume, and are not split by fuel type in the source report.
Petrol — May to June 2026
Petrol pump prices fell 6ppl over May–June 2026, while crude oil costs fell 10ppl over the same period. Using a two-week lag as a proxy for the time it takes retailers to sell through purchased stock, petrol margins generally remained below their pre-conflict level — the CMA's evidence suggests petrol consumers benefited overall from the wholesale price falls.
Diesel — May to June 2026
Diesel pump prices fell 23ppl over May–June 2026, while crude oil costs fell 10ppl and refining spreads fell 11ppl over the same period. Diesel margins "tended to remain above their pre-conflict level over the same period, falling to pre-conflict levels only at the end of June" — the CMA says this "suggests that retailer responses to reductions in wholesale diesel costs may have been more delayed."
The CMA noted that "some retailers gained a competitive advantage when wholesale diesel costs fell...but did not pass on these cost reductions to drivers more quickly in an attempt to gain market share", attributing this partly to passive pricing strategies. It found no evidence that retailers actively changed strategy to exploit the conflict, but margins "continued to be at or above the historically high level observed in 2025."
A more detailed assessment of pass-through timeliness, and of local/regional price variation, is due in the CMA's Autumn 2026 report (not yet published as of 19 September 2026).
Source: CMA Enhanced Road Fuel Monitoring report, August 2026, via GOV.UK — published 18 August 2026, data to End of June 2026.
Where the CMA has investigated, we link directly to its findings.
How much of the price is tax?
The tax question
Fuel Duty
52.95p per litre
VAT
20%
That remaining 87.2p is not automatically "oil company profit". It covers wholesale fuel costs, refining, distribution, and the retailer's operating costs and margin, combined — we do not have a further verified split of that remainder, so we don't pretend otherwise.
Why is fuel more expensive than it used to be?
Price vs purchasing power
Not just what the price was — what it meant relative to income at the time.
2026
Historical dataPetrol
168.14p/litre
Diesel
190.72p/litre
Fuel Duty
52.95p/litre
VAT
20%
Minimum Wage
£12.71/hour
Average Earnings
Not yet verified
Bank Rate
3.75%
CPI index
Not yet verified
Source: GOV.UK / DESNZ — Weekly road fuel prices / GOV.UK / Bank of England (see individual figures) — view source
Make it interactive
Build the Pump Price
Drag the sliders to explore a hypothetical price.
Hypothetical pump price
168.1p
Pre-tax subtotal 140.1p + VAT 28.0p
This model starts from today's verified breakdown and simply recalculates the arithmetic total as you move each slider — it does not simulate how a real change in one component (e.g. crude oil) would actually flow through refining margins or wholesale prices in practice.
A litre is small. The bill isn't.
The number on the pump is only one part of the story
From the pump to the year
A small per-litre number becomes a much larger annual one — shown against real earnings figures.
Illustrative example — not a national average
Choose a commute distance to see how a small daily number becomes a much larger annual one. This uses today's verified petrol price (168.1p/litre); the mileage and vehicle economy below are assumptions you can change, not published averages.
Daily commute (round trip)
Per day
£3.82
Per week
£19.10
Per month
£82.79
Per year
£993.46
In terms of pay
This weekly fuel cost is approximately 2.7% of average weekly earnings (£705/week, May–July 2026 (3-month average), Great Britain), or the equivalent of 1.5 hours of work at the National Living Wage (£12.71/hour).
Sources: ONS — Average Weekly Earnings in Great Britain; GOV.UK — National Minimum Wage and National Living Wage rates. Fuel figures calculated from today's verified petrol price (Week commencing 14 September 2026).
More ways to explore
More tools
100-Mile Journey
Year
Cost of a 100-mile journey, 2026
£19.11
11.4 litres used
Based on the average verified petrol price for 2026. Real-world consumption varies with driving style, terrain, weather, and vehicle condition.
One Hour of Work
Petrol
7.6L
At 2026's minimum wage (£12.71/hour), one hour of work bought approximately this many litres of petrol.
Diesel
6.7L
The same calculation for diesel.
Source: GOV.UK / DESNZ — Weekly road fuel prices / GOV.UK / Bank of England (see individual figures) — view source
Follow £50
Based on a petrol price of 168.1p/litre in 2026. The exact split varies with the fuel price, wholesale costs, retailer margins, and VAT at any given time — this is not a fixed formula.
Oil Down — Pump Down?
Crude oil vs UK pump prices, over time
HISTORICALTwo genuine primary sources, indexed so they can be compared on the same chart: UK pump prices from GOV.UK's official weekly series, and Brent crude oil spot prices from the U.S. Energy Information Administration (EIA). Each line is indexed to 100 at the start of the selected window — this shows relative change, not the actual price levels (which are in different currencies and units).
Each line is indexed to its own starting value = 100, so series in different units (e.g. pence/litre vs US$/barrel) can be compared by % change rather than raw size.
Pump prices: GOV.UK / DESNZ — Weekly road fuel prices
Crude oil: U.S. Energy Information Administration (EIA) — Weekly Europe Brent Spot Price FOB
These prices are connected, but they are not identical and do not necessarily move at the same speed.
Global profit isn't UK pump profit.
And then there's the profit question
Billions — but from what?
Shell plc
FY2025
- Revenue
- £204,996m
- Income attributable to Shell plc shareholders
- £13,359m
- Adjusted Earnings (non-GAAP)
- £13,876m
- Prior year
- £12,053m
- Year-on-year change
- +10.8%
Operates across: Oil production, Natural gas, LNG, Refining, Chemicals, Trading, Retail, Renewables & energy solutions.
BP plc
FY2025
- Revenue
- £144,199m
- Profit for the year attributable to bp shareholders
- £41m
- Underlying replacement cost (RC) profit (non-GAAP)
- £5,605m
- Prior year
- £285m
- Year-on-year change
- -85.6%
Operates across: Oil production, Natural gas, Refining, Trading & shipping, Retail (fuel & convenience), Low carbon energy.
ExxonMobil
FY2025
- Revenue
- £248,812m
- Net income attributable to ExxonMobil
- £21,601m
- Earnings excluding identified items (non-GAAP)
- £22,548m
- Prior year
- £25,223m
- Year-on-year change
- -14.3%
Operates across: Upstream (oil & gas production), Product Solutions (refining, chemicals, fuels), Low Carbon Solutions.
TotalEnergies
FY2025
- Revenue
- £136,557m
- Net income (TotalEnergies share, IFRS)
- £9,831m
- Adjusted net income (TotalEnergies share, non-GAAP)
- £11,673m
- Prior year
- £11,801m
- Year-on-year change
- -17.0%
Operates across: Exploration & production, Integrated LNG, Refining & chemicals, Marketing & services, Integrated power (renewables & electricity).
Chevron
FY2025
- Revenue
- £141,564m
- Net income attributable to Chevron Corporation
- £9,211m
- Adjusted earnings (non-GAAP)
- £10,126m
- Prior year
- £13,226m
- Year-on-year change
- -30.4%
Operates across: Upstream (oil & gas production), Downstream (refining, marketing, retail), Chemicals, New energies.
Every figure above is verified and sourced.
All five companies report in US dollars. Figures above are converted to pounds sterling at £1 = $1.3353 (Bank of England, spot rate, 17 September 2026) — a single current exchange rate applied to each company's most recent full-year results, so these are approximate GBP equivalents rather than a rate fixed by the companies themselves.
Corporate profit is not the same as UK forecourt profit
These companies report global, group-wide results across oil production, natural gas, LNG, refining, chemicals, trading, retail, and renewable energy businesses — most of which has nothing to do with what a UK driver pays at a specific forecourt. A large global profit figure does not tell you how much profit was made on a single litre of fuel sold in England, and should not be read as if it does.
The question this data can't answer
How much of that is UK petrol?
None of these companies separately publish how much profit they make specifically from selling petrol and diesel at UK forecourts. Fuel retail is a small part of a much larger global business, often reported (if at all) only as part of a combined "marketing" or "retail" segment covering many countries and products.
DATA NOT AVAILABLE
We do not estimate or invent this figure. If a company publishes a genuine UK-specific fuel-retail profit figure in the future, we will add it here with a direct source.
Revenue isn't profit.
What does government collect?
Government revenue, not government profit
Tax receipts form part of public revenue and help fund public spending — a different thing from company profit.
Fuel Duty — full financial year
£24.25bn
Financial year 2025 to 2026 (provisional) · as of 31 July 2026
Fuel Duty — year to date
£8.4bn
April to July 2026 · as of 21 August 2026
Fuel Duty — latest quarter
£6.37bn
April to June 2026 (provisional) · petrol £2.58bn, diesel £3.72bn
VAT on fuel
Not separately published
HMRC does not publish a fuel-specific VAT receipts figure
Total fuel-related tax
Not calculated
Only shown once components are genuinely comparable — see note below
Where an amount is estimated rather than directly reported, it is labelled as an estimate.
The full-year and year-to-date Fuel Duty figures come from two different HMRC publications with different cut-off dates — they are not directly comparable to each other and are shown separately for that reason.
The big FCE question
So who is responsible for the price?
No single factor determines the price of fuel. But every part of the chain can be examined.
And where Government has direct influence — particularly taxation — citizens can reasonably ask what policy choices are being made.
Where companies operate within the market, citizens can also ask questions about competition, transparency, margins and profits.
It's not just about the price.
- It's about understanding why the price is what it is.
- It's about understanding what Government collects.
- It's about understanding what businesses spend and earn.
- It's about understanding how global markets affect the UK.
- It's about understanding why the cost of living has risen.
- And it's about understanding whether people's incomes and purchasing power have kept pace.
Follow the money. Check the evidence. Ask the questions.