The full investigation
Follow the money.
What motorists pay, what government collects, what energy companies report, how the numbers have changed since 1995, and what policy choices exist — with verified figures, clear sourcing, and evidence rather than assumptions.
How to read this page
Every claim below is labelled as one of these. We do not present campaign commentary or public opinion as if it were a verified figure.
The signature feature
Follow the £50
Enter an amount, then watch it move through the system — tax, industry, and retail.
£50
A typical fuel purchase
Where does it go?
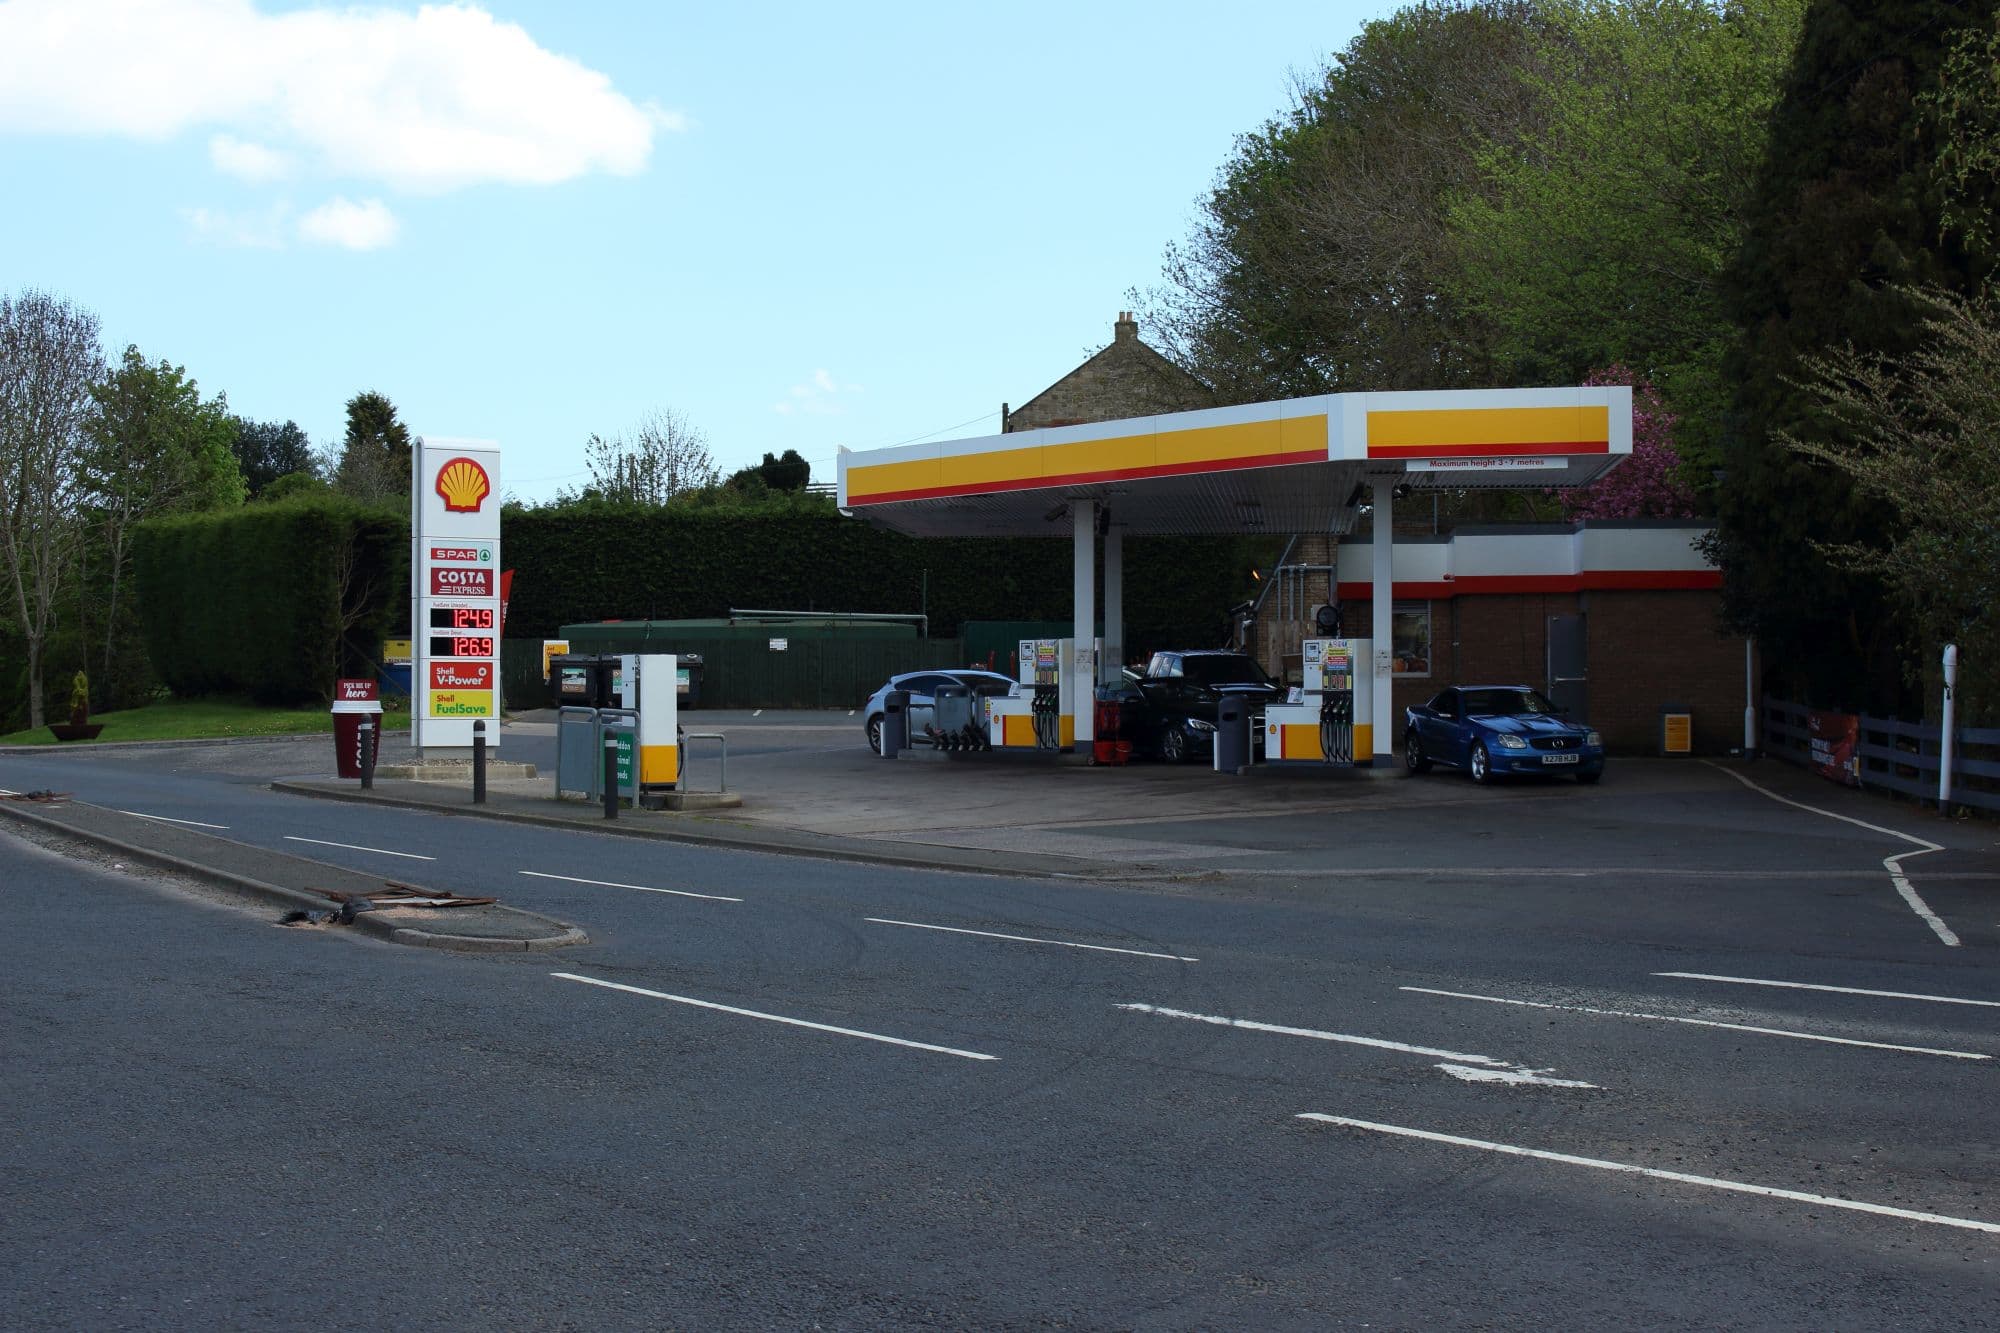
Photo: Graham Robson, via Wikimedia Commons (CC BY-SA 2.0)
Based on a petrol price of 168.1p/litre in 2026. The exact split varies with the fuel price, wholesale costs, retailer margins, and VAT at any given time — this is not a fixed formula.
How much are companies making?
Billions — But From What?
Verified annual financial results for five major energy companies, with each accounting measure clearly labelled.
Shell plc
FY2025
- Revenue
- £204,996m
- Income attributable to Shell plc shareholders
- £13,359m
- Adjusted Earnings (non-GAAP)
- £13,876m
- Prior year
- £12,053m
- Year-on-year change
- +10.8%
Operates across: Oil production, Natural gas, LNG, Refining, Chemicals, Trading, Retail, Renewables & energy solutions.
BP plc
FY2025
- Revenue
- £144,199m
- Profit for the year attributable to bp shareholders
- £41m
- Underlying replacement cost (RC) profit (non-GAAP)
- £5,605m
- Prior year
- £285m
- Year-on-year change
- -85.6%
Operates across: Oil production, Natural gas, Refining, Trading & shipping, Retail (fuel & convenience), Low carbon energy.
ExxonMobil
FY2025
- Revenue
- £248,812m
- Net income attributable to ExxonMobil
- £21,601m
- Earnings excluding identified items (non-GAAP)
- £22,548m
- Prior year
- £25,223m
- Year-on-year change
- -14.3%
Operates across: Upstream (oil & gas production), Product Solutions (refining, chemicals, fuels), Low Carbon Solutions.
TotalEnergies
FY2025
- Revenue
- £136,557m
- Net income (TotalEnergies share, IFRS)
- £9,831m
- Adjusted net income (TotalEnergies share, non-GAAP)
- £11,673m
- Prior year
- £11,801m
- Year-on-year change
- -17.0%
Operates across: Exploration & production, Integrated LNG, Refining & chemicals, Marketing & services, Integrated power (renewables & electricity).
Chevron
FY2025
- Revenue
- £141,564m
- Net income attributable to Chevron Corporation
- £9,211m
- Adjusted earnings (non-GAAP)
- £10,126m
- Prior year
- £13,226m
- Year-on-year change
- -30.4%
Operates across: Upstream (oil & gas production), Downstream (refining, marketing, retail), Chemicals, New energies.
Every figure above is verified and sourced.
All five companies report in US dollars. Figures above are converted to pounds sterling at £1 = $1.3353 (Bank of England, spot rate, 17 September 2026) — a single current exchange rate applied to each company's most recent full-year results, so these are approximate GBP equivalents rather than a rate fixed by the companies themselves.
Corporate profit is not the same as UK forecourt profit
These companies report global, group-wide results across oil production, natural gas, LNG, refining, chemicals, trading, retail, and renewable energy businesses — most of which has nothing to do with what a UK driver pays at a specific forecourt. A large global profit figure does not tell you how much profit was made on a single litre of fuel sold in England, and should not be read as if it does.
The question this data can't answer
How much of that is UK petrol?
None of these companies separately publish how much profit they make specifically from selling petrol and diesel at UK forecourts. Fuel retail is a small part of a much larger global business, often reported (if at all) only as part of a combined "marketing" or "retail" segment covering many countries and products.
DATA NOT AVAILABLE
We do not estimate or invent this figure. If a company publishes a genuine UK-specific fuel-retail profit figure in the future, we will add it here with a direct source.
Making big numbers make sense
What does a billion pounds actually look like?
In full
£0
As billions
£0 billion
As millions
0 million
A billion is a thousand million — one thousand times larger than a million. Company profit and government receipt figures on this page are usually reported in millions; we show them here at scale so the size of the number is easier to grasp.
Explore the trends
Corporate Profits vs Fuel Prices
An interactive comparison — not proof of cause and effect.
Corporate Profits vs Fuel Prices
Historical dataChoose a company, then select which trends to compare on the same indexed chart. Different measures (pence per litre, pounds, percentages) are shown as an index relative to their starting value so trends can be compared side by side.
Each line is indexed to its own starting value = 100, so series in different units (e.g. pence/litre vs US$/barrel) can be compared by % change rather than raw size.
Correlation does not necessarily mean that one factor caused another.
Where does your money go?
Where does the money from a litre of fuel go?
A verified breakdown of an average litre's pump price, with the date, source, and methodology for every figure.
Petrol (unleaded)
Live data- Wholesale fuel, refining & distribution75.8p (45.1%)
- Fuel duty53.0p (31.5%)
- VAT (20%)28.0p (16.7%)
- Retailer / forecourt margin11.3p (6.7%)
As of 14 September 2026. Source: GOV.UK (fuel duty, VAT) and CMA Enhanced Road Fuel Monitoring report (retailer margin), via GOV.UK
Methodology: Fuel duty (52.95 pence/litre) and the 20% VAT rate are exact, verified figures from GOV.UK, calculated against an average pump price of 168.1p/litre (GOV.UK/DESNZ weekly road fuel prices, week commencing 14 September 2026). The retailer margin (11.3 pence/litre) is the CMA's reported average market-wide petrol margin for April 2026 (Enhanced Road Fuel Monitoring report, published via GOV.UK). 'Wholesale, refining & distribution' is the remainder after duty, VAT, and margin are subtracted — it is a calculated figure, not a separately published one, and bundles crude oil cost, refining, and distribution together since no further verified split was available. Because the margin figure and the pump price are from slightly different dates, this breakdown is an approximation, not an exact same-day figure.
The site's signature interactive feature
Follow The Money: 1995 → Today
Move the slider to see how fuel prices, tax, wages and inflation have changed.
2026
Historical dataPetrol
168.14p/litre
Diesel
190.72p/litre
Fuel Duty
52.95p/litre
VAT
20%
Minimum Wage
£12.71/hour
Average Earnings
Not yet verified
Bank Rate
3.75%
CPI index
Not yet verified
Source: GOV.UK / DESNZ — Weekly road fuel prices / GOV.UK / Bank of England (see individual figures) — view source
How much of your working hour buys fuel?
Your Wage vs The Pump
Minimum hourly wage ÷ fuel price, using each rate's actual effective date.
Petrol
7.6L
At 2026's minimum wage (£12.71/hour), one hour of work bought approximately this many litres of petrol.
Diesel
6.7L
The same calculation for diesel.
Source: GOV.UK / DESNZ — Weekly road fuel prices / GOV.UK / Bank of England (see individual figures) — view source
A historical comparison
What Did £20 Buy?
Petrol litres
11.9litres
Diesel litres
10.5litres
Minimum-wage hours required
1.6hours
Average earnings context
Not yet verified for this year
"Equivalent modern purchasing power" (inflation-adjusted) will be added once a verified CPI index level for 2026 is connected — we don't estimate this figure in the meantime.
An honest question
Are Energy Companies Making Excessive Profits?
We don't answer yes or no. Here's what 'excessive profit', 'profiteering' and 'windfall profits' actually mean, and the evidence available.
These words don't all mean the same thing
- Excessive profit
- No single legal or economic definition — often used loosely to mean profit that seems disproportionate to risk, investment, or market conditions.
- Profiteering
- Generally implies deliberately exploiting a crisis or shortage to charge more than is fair — a stronger claim that typically requires specific evidence of conduct, not just a profit figure.
- Windfall profit
- An unexpected profit arising from external circumstances (e.g. a price spike) rather than a company's own decisions — the basis some governments have used for one-off windfall taxes.
The evidence, honestly labelled
- Global profit & revenueLive data
- Margins (where available)Data unavailable
- Taxes paidData unavailable
- DividendsData unavailable
- Share buybacksData unavailable
- InvestmentData unavailable
- ProductionData unavailable
- UK-specific informationData unavailable
Where a figure isn't yet verified, we don't estimate it — we show that gap honestly so you know what evidence is and isn't behind a conclusion.
The limits of comparing global companies to UK prices
Shell, BP, ExxonMobil, Chevron and TotalEnergies are global businesses whose profit reflects production, refining, trading and retail activity worldwide — not specifically what happens at a UK forecourt. A high global profit figure is not, by itself, evidence about UK pump pricing specifically; UK-specific evidence (like CMA retail margin monitoring) is a separate, narrower data source better suited to that question.
No. A large global profit figure, on its own, does not prove that a company has broken competition law or acted unfairly. Establishing unfair pricing or anti-competitive behaviour requires specific regulatory investigation and evidence — it is not something that can be concluded from a headline profit number alone.
Relevant investigations and regulatory findings
The Competition and Markets Authority has carried out monitoring and studies of the UK road fuel market, including retailer margins and regional pricing. We link to the regulator directly rather than summarising specific findings we haven't independently verified.
Search CMA road fuel market findingsWe deliberately don't draw a conclusion for you here — read the evidence and decide for yourself.
A large dashboard
What Does Government Collect?
Fuel Duty — full financial year
£24.25bn
Financial year 2025 to 2026 (provisional) · as of 31 July 2026
Fuel Duty — year to date
£8.4bn
April to July 2026 · as of 21 August 2026
Fuel Duty — latest quarter
£6.37bn
April to June 2026 (provisional) · petrol £2.58bn, diesel £3.72bn
VAT on fuel
Not separately published
HMRC does not publish a fuel-specific VAT receipts figure
Total fuel-related tax
Not calculated
Only shown once components are genuinely comparable — see note below
Where an amount is estimated rather than directly reported, it is labelled as an estimate.
The full-year and year-to-date Fuel Duty figures come from two different HMRC publications with different cut-off dates — they are not directly comparable to each other and are shown separately for that reason.
What we are asking for
Our Public Policy Demands
Freezing Fuel Duty, reviewing fuel taxation, investigating excessive profits, and more — with clear explainers on what government can and can't do quickly.
Are wages keeping up?
Are Wages Keeping Up?
How wages, inflation, and the minimum wage compare over time.
National Minimum Wage / National Living Wage
Rates changed from 1 April 2026, shown alongside the previous rates effective from 1 April 2025.
| Band | From 1 April 2026 | From 1 April 2025 |
|---|---|---|
| 21 and over (National Living Wage) | £12.71 | £12.21 |
| 18 to 20 | £10.85 | £10.00 |
| Under 18 | £8.00 | £7.55 |
| Apprentice | £8.00 | £7.55 |
Source: GOV.UK — National Minimum Wage and National Living Wage rates
The minimum wage has increased substantially over time — it has not stood still. The more meaningful question is not whether it has risen, but whether those increases have kept pace with the overall cost of living workers actually face, including housing, energy, food, and transport costs. See Are Wages Keeping Up? below.
Minimum wage vs median earnings
How the wage floor compares to typical pay over time.
- National Living Wage (21+ rate)
- Nominal (not inflation-adjusted) · Source: GOV.UK — National Minimum Wage and National Living Wage rates (as of 1 April 2026)
- Median full-time weekly earnings
- Nominal (not inflation-adjusted) · Source: ONS — Annual Survey of Hours and Earnings (ASHE), Employee earnings in the UK: 2025 (as of 1 April 2025)
Inflation (CPI) over time
Annual UK Consumer Prices Index inflation rate.
- CPI inflation rate
- Nominal (not inflation-adjusted) · Source: ONS — Consumer price inflation, UK (monthly bulletins) (as of 16 September 2026)
Fuel prices over time
Average petrol price, for context alongside wages and inflation.
- UK average petrol price
- Nominal (not inflation-adjusted) · Source: GOV.UK / DESNZ — Weekly road fuel prices (as of 14 September 2026)
Bank Rate over time
Bank of England Bank Rate, which affects mortgage and borrowing costs.
- Bank of England Bank Rate
- Nominal (not inflation-adjusted) · Source: Bank of England — Official Bank Rate history database (as of 18 December 2025)
What do we mean by this?
The Wage Gap
'Wage gap' can mean several different things. Choose a specific comparison below rather than one ambiguous measure.
Choose a comparison:
Minimum wage vs median wage
Compares the statutory minimum hourly rate to the median hourly wage across all employees. This shows how far the wage floor sits below typical pay — it does not measure how many people are paid the minimum, or how pay is distributed above it.
Minimum wage vs median wage
This chart will appear once verified historical data is connected.
Borrowing, saving, and inflation
Interest Rates & The Cost of Living
Bank Rate
The interest rate set by the Bank of England, which influences most other interest rates in the UK economy.
Mortgage costs
Many mortgages track or are influenced by Bank Rate, so changes can directly affect monthly mortgage payments, particularly for tracker and new fixed-rate deals.
Borrowing costs
Loans, credit cards, and other borrowing tend to become more expensive when Bank Rate rises, and cheaper when it falls.
Credit costs
The cost of using credit — including overdrafts and store finance — is influenced by the wider interest rate environment.
Savings rates
Higher Bank Rate can mean better returns on savings accounts, though banks don't always pass on the full change immediately.
Business borrowing
Businesses financing stock, equipment, or expansion face higher or lower borrowing costs as rates move, which can feed into prices they charge.
Higher interest rates cut both ways.
Bank of England Bank Rate over time
Historical Bank Rate, sourced from the Bank of England.
- Bank of England Bank Rate
- Nominal (not inflation-adjusted) · Source: Bank of England — Official Bank Rate history database (as of 18 December 2025)
How it all connects
What Does It Mean For Ordinary People?
These relationships are complex, run in more than one direction, and interact with many other factors beyond fuel prices. We present the evidence and the connections between these costs rather than claiming any single cause explains everything.
The full picture, not just the highlights
Corporate Profits Timeline
Shell and BP's annual results since 2015 — including the weaker years, not just the strongest ones.
Shell
Historical data| Year | Net income | Revenue | Context |
|---|---|---|---|
| FY2015 | £1,452m | £198,427m | Global oil price crash: OPEC did not cut production amid a US shale oversupply, and prices fell sharply through the year. |
| FY2016 | £3,426m | £174,935m | Oil prices remained depressed for most of the year before OPEC agreed output cuts in November 2016. |
| FY2017 | £9,718m | £228,547m | Gradual price recovery as OPEC+ production cuts took hold. |
| FY2018 | £17,488m | £290,855m | Prices strengthened through most of the year before a sharp Q4 2018 sell-off. |
| FY2019 | £11,864m | £258,277m | Relatively stable prices; weaker refining and trading conditions than 2018. |
| FY2020 | -£16,236m | £135,208m | COVID-19 demand collapse. Oil prices fell sharply, and Shell recorded a net loss with large impairments. |
| FY2021 | £15,054m | £195,839m | Demand and prices recovered as COVID-19 restrictions eased through the year. |
| FY2022 | £31,685m | £285,564m | Russia's invasion of Ukraine in February 2022 drove a sharp rise in global energy prices; Shell's highest annual profit in this timeline. |
| FY2023 | £14,499m | £237,115m | Prices normalised down from the 2022 peak. |
| FY2024 | £12,053m | £212,920m | Continued softening of oil and gas prices through the year. |
| FY2025 | £13,359m | £199,870m | Shell's own reporting shows average Brent crude prices falling further year-on-year. |
BP
Historical data| Year | Net income | Revenue | Context |
|---|---|---|---|
| FY2015 | -£4,854m | £169,268m | Global oil price crash weighed heavily on BP's results. |
| FY2016 | £86m | £139,748m | Oil prices remained near the bottom of the downturn for most of the year. |
| FY2017 | £2,538m | £183,166m | Gradual recovery as OPEC+ cuts took hold. |
| FY2018 | £7,027m | £227,468m | Stronger prices through most of the year. |
| FY2019 | £3,015m | £211,650m | Relatively stable prices. |
| FY2020 | -£15,206m | £137,422m | COVID-19 demand collapse; BP recorded a large net loss with significant impairments. |
| FY2021 | £5,665m | £122,965m | Demand and prices recovered through the year. |
| FY2022 | -£1,863m | £186,393m | Statutory loss driven by a ~£18bn charge for exiting BP's stake in Rosneft following Russia's invasion of Ukraine — even though underlying replacement cost profit was a record £20,712m the same year. |
| FY2023 | £11,412m | £159,539m | Prices normalised down from the 2022 peak. |
| FY2024 | £285m | £145,757m | Weaker refining margins and lower prices reduced statutory profit close to zero. |
| FY2025 | £41m | £144,199m | Statutory profit remained close to zero despite underlying replacement cost profit of £5,606m, again showing the gap between the two measures. |
Shell and BP report in US dollars. Figures above are converted to pounds sterling at £1 = $1.3353 (Bank of England, spot rate, 17 September 2026) for every year shown — a single fixed rate, not the historical rate for each year — so these are approximate, present-day GBP equivalents rather than what the amount was worth in pounds at the time.
People have every right to ask questions when they see the price of fuel, the cost of living, and corporate profits changing at the same time.
We believe those questions should be answered with evidence, transparency, and publicly available data.
- How much are companies making?
- How much of the price at the pump is tax?
- How much goes to wholesale and refining costs?
- How much does the forecourt actually retain?
- And how are wages and household incomes changing at the same time?
Fuel Crisis England exists to help people investigate those questions for themselves.
Fact-checked, always
Our Sources
Every major statistic on this page is sourced and dated inline, next to the figure itself. These are the primary organisations we draw from.
GOV.UK
National Minimum Wage and National Living Wage rates, and fuel duty and VAT policy.
Visit official site GovernmentLow Pay Commission
The independent body that recommends National Minimum Wage and National Living Wage rates to government.
Visit official site StatisticsOffice for National Statistics (ONS)
Median and average earnings, CPI/CPIH inflation, and household income distribution statistics.
Visit official site GovernmentBank of England
Bank Rate decisions and historical data, and analysis of borrowing and inflation.
Visit official site RegulatorCompetition and Markets Authority (CMA)
Road fuel market studies, including analysis of retailer margins and pump price components.
Visit official site ParliamentUK Parliament
Committee inquiries and reports on fuel prices, energy company profits, and the cost of living.
Visit official site CompanyShell plc — Investor Relations
Official annual reports and financial results.
Visit official site CompanyBP plc — Investor Relations
Official annual reports and financial results.
Visit official site Motoring organisationRAC Fuel Watch
Independent analysis of UK pump prices and their components.
Visit official site Motoring organisationThe AA — Fuel Price Reports
Independent analysis of UK pump prices.
Visit official siteAsk questions. Follow the money. Check the evidence. Make your voice heard.